Building Email Lists Through Social Media: 2025 Ecommerce Guide
June 8, 2025
Google Ads Pricing in India (2026): The Ultimate Guide to PPC Costs
March 25, 2026
Sarah's Shopify jewelry store was bleeding money. Despite beautiful products and competitive prices, her conversion rate sat below the industry average of 3.52%. Her product pages looked like digital textbooks—dense descriptions, boring specifications, and zero visual appeal.
Then she discovered the power of infographic as an e-commerce marketing strategy.
Within 90 days of implementing visual content across her store, Sarah's metrics improved significantly. Her secret? Strategic infographics that transformed complex product information into compelling visual stories that customers could process 60,000 times faster than text.
If you're a Shopify merchant, B2B e-commerce manager, or online retailer struggling with low conversions, high bounce rates, or ineffective marketing campaigns, this comprehensive guide will show you exactly how to leverage infographics for measurable e-commerce growth.
Table of contents
- The E-commerce Visual Marketing Revolution: Why Infographics Matter More Than Ever
- 1. Transform Product Education Into Conversion Catalysts
- 2. Amplify Social Commerce Through Shareable Visual Content
- 3. Eliminate Cart Abandonment with Strategic Visual Reassurance
- 4. Supercharge Email Marketing with Visual Storytelling
- 5. Dominate Search Results with Visual SEO Optimization
- 6. Accelerate B2B Sales Cycles with Educational Visual Content
- 7. Revolutionize Customer Support and Reduce Operational Costs
- Frequently Asked Questions: Infographics for E-commerce Success
- Implementation Roadmap: Your 90-Day Infographic Strategy
The E-commerce Visual Marketing Revolution: Why Infographics Matter More Than Ever
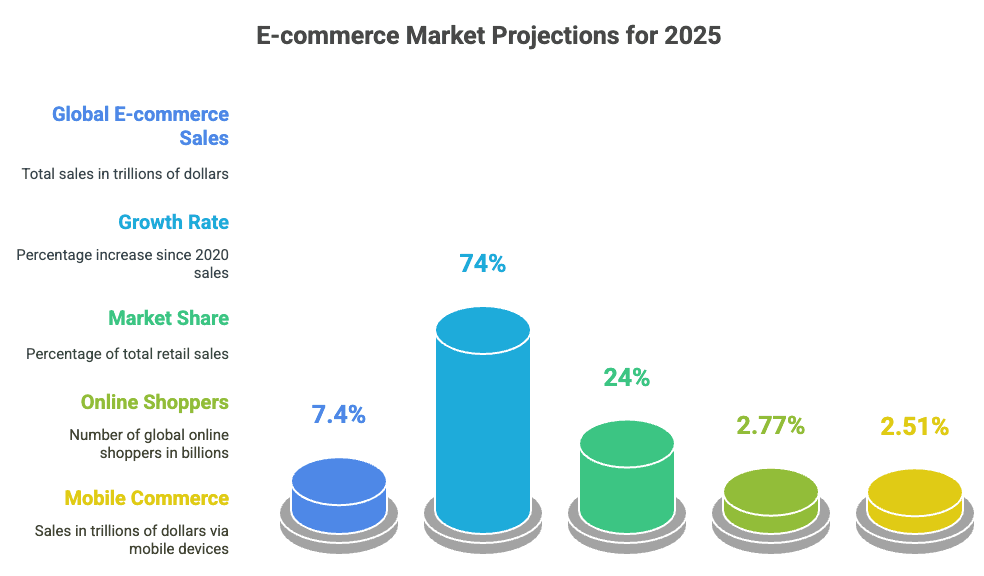
The e-commerce landscape has fundamentally shifted. Modern online shoppers are overwhelmed by choices, skeptical of claims, and have shorter attention spans than ever before. Current market data shows that:
Global e-commerce sales are projected to reach $7.4 trillion in 2025
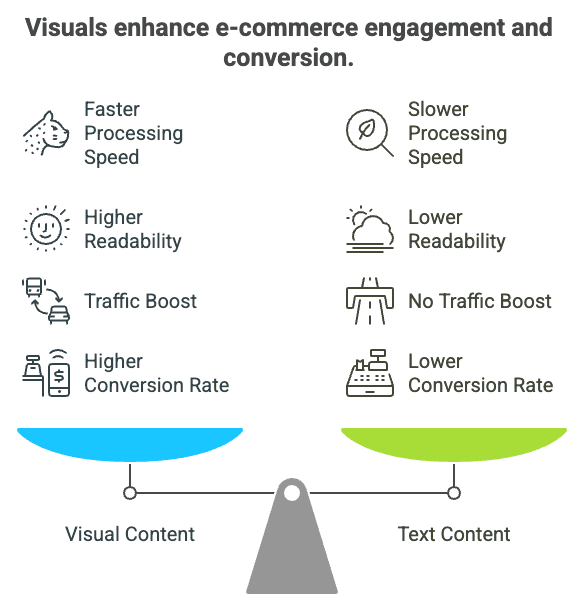
Brands using visual content see 7 times higher conversion rates than those that don't
87% of online shoppers have been persuaded to purchase after watching a video
Mobile shoppers represent 44% of all e-commerce sales in the US
For e-commerce businesses, this isn't just marketing theory—it's a competitive necessity. Brands that fail to embrace visual storytelling are literally invisible to today's consumers.
1. Transform Product Education Into Conversion Catalysts
The biggest obstacle between browsers and buyers? Confusion. Complex products, unclear benefits, and overwhelming specifications create friction that kills conversions.
E-commerce Infographic Applications:
Technical Product Breakdowns: Create visual specification sheets that highlight key features without overwhelming customers. Research shows that high-quality visuals can increase conversions significantly compared to text-only product descriptions.
Size and Fit Guides: Visual sizing charts reduce returns and boost confidence. The luxury and jewelry sector, which sees cart abandonment rates of 81.4%, can particularly benefit from clear visual guides.
Ingredient and Material Explanations: Perfect for beauty, health, and fashion e-commerce. Show ingredient benefits, material comparisons, and quality certifications visually.
Installation and Setup Instructions: Transform intimidating assembly processes into friendly visual guides that reduce support tickets and improve customer satisfaction.
Implementation Strategy:
Start by identifying your most returned or questioned products. Create simple before/after infographics showing problem → solution → result.
Test these on high-traffic product pages first.
2. Amplify Social Commerce Through Shareable Visual Content
Social media drives significant e-commerce traffic, with 53% of Americans shopping on social media at least once per week. However, generic product photos get ignored. Infographics designed for social sharing can dramatically expand your reach and drive qualified traffic back to your store.
High-Performance Social Infographic Formats:
"How-To" Series: Create step-by-step guides featuring your products. Visual content performs exceptionally well on platforms like Instagram and Pinterest.
Trend Reports and Industry Insights: Position your brand as an authority by creating data-driven infographics about your industry. This approach helps build trust with potential customers.
Customer Success Stories: Transform testimonials into visual case studies. Include before/after photos, statistics, and quote highlights for maximum impact.
Seasonal Buying Guides: Create gift guides, seasonal trends, and holiday shopping infographics that naturally feature your products without being overly promotional.
Social Media Optimization Tips:
Design square formats for Instagram and Facebook
Include your brand logo subtly but consistently
Use platform-specific hashtags and descriptions
3. Eliminate Cart Abandonment with Strategic Visual Reassurance
Cart abandonment costs e-commerce businesses $18 billion annually, with 70% of online shopping carts abandoned on average. The primary culprits include unexpected costs (48% of abandonments), security concerns, and delivery uncertainty. Infographics can address these concerns proactively.
Cart Abandonment Prevention Strategies:
Shipping and Delivery Timelines: Create visual shipping guides showing delivery expectations, packaging processes, and tracking information to address the 48% of customers who abandon due to unexpected costs.
Return and Exchange Policies: Transform complex return policies into simple visual flowcharts. Make returns feel easy and risk-free.
Security and Trust Indicators: Design infographics highlighting security certifications, payment protections, and customer guarantees.
Total Cost Breakdowns: Use visual pricing charts to eliminate surprises at checkout. Show product cost, shipping, taxes, and any fees upfront.
Checkout Optimization:
Place these infographics strategically throughout the customer journey product pages, cart pages, and checkout flows.
4. Supercharge Email Marketing with Visual Storytelling
Email marketing delivers exceptional ROI, with every $1 spent returning $36 (a 3600% ROI). However, this only works when emails get opened and engaged with. Infographics can dramatically improve email performance.
Email Infographic Strategies:
Product Launch Announcements: Instead of text-heavy product descriptions, create visual feature highlights and benefit summaries.
Customer Journey Maps: For B2B e-commerce, visualize the entire customer experience from awareness to advocacy.
Educational Content Series: Create weekly infographic tips, guides, or industry insights that provide value while subtly promoting products.
Personalized Recommendations: Use data to create custom infographic recommendations based on browsing history and purchase patterns.
Email Performance Benefits:
Visual elements in emails can significantly improve engagement, as 88% of users check their email multiple times daily, and 50% will delete emails that aren't optimized for mobile.
5. Dominate Search Results with Visual SEO Optimization
Google's algorithm increasingly rewards diverse, helpful content. Infographics can help you capture featured snippets, image search traffic, and voice search results.
SEO Optimized Infographic Strategy:
Featured Snippet Targeting: Create infographics that answer specific questions your customers ask. Format them as step-by-step guides, comparison charts, or how-to visuals.
Image Search Optimization: Optimize alt text, file names, and surrounding content for product-related image searches. This drives highly qualified traffic to product pages.
Voice Search Compatibility: Design infographics that answer conversational queries. Include FAQ style visuals that match how people speak, not just how they type.
Local SEO Enhancement: For businesses with physical locations, create infographics about local trends, events, or community involvement.
Technical Implementation:
Use descriptive file names with target keywords
Include comprehensive alt text descriptions
Add structured data markup for enhanced rich snippets
6. Accelerate B2B Sales Cycles with Educational Visual Content
B2B e-commerce faces unique challenges: longer sales cycles, multiple decision-makers, and complex products. Infographics can simplify complicated concepts and accelerate purchasing decisions.
B2B Ecommerce Infographic Applications:
ROI Calculators and Cost Comparisons: Visual representations of savings, efficiency gains, and investment returns resonate with business buyers.
Implementation Timelines: Show exactly what the onboarding or installation process looks like, reducing buyer anxiety about complex purchases.
Compliance and Certification Guides: For regulated industries, create infographics explaining how your products meet specific requirements.
Case Study Summaries: Transform lengthy case studies into scannable infographic summaries that busy executives can digest quickly.
Research shows that visual case studies can significantly improve engagement and conversion rates when properly implemented
7. Revolutionize Customer Support and Reduce Operational Costs
Customer support costs can make or break e-commerce profitability. Visual support materials reduce ticket volume while improving customer satisfaction.
Support Optimization Strategies:
Self-Service Visual Guides: Create infographic troubleshooting flowcharts for common issues. Visual guides help customers resolve problems independently.
Product Care and Maintenance: Design visual care instructions that extend product life and reduce warranty claims.
FAQ Infographics: Transform boring FAQ sections into engaging visual Q&A guides that customers actually read.
Onboarding and Setup Assistance: Help customers succeed with their purchases through visual onboarding sequences.
Frequently Asked Questions: Infographics for E-commerce Success
Q: How do I measure the ROI of infographic marketing for my online store?
A: Track these key metrics:
Conversion rate improvements on pages with infographics vs. without
Time on page and bounce rate changes after adding visual content
Social shares and engagement rates for infographic posts
Reduction in support tickets for products with visual guides
Email click-through rates for campaigns featuring infographics
Most e-commerce businesses see measurable improvements within 30-60 days of implementation.
Q: What's the best way to create infographics if I don't have design skills?
A: Start with these approaches:
Templates: Use Canva, Adobe Express, or Venngage for professional templates
Data visualization: Tools like Piktochart excel at turning statistics into visuals
Hire freelancers: Platforms like 99designs or Upwork offer affordable design services
AI-powered tools: Newer platforms like Simplified or Gamma can generate infographics from text prompts
The key is consistency, establish brand colors, fonts, and style guidelines before creating multiple graphics.
Q: Which types of infographics work best for mobile e-commerce?
A: Mobile-optimized infographics should be:
Vertical format: Designed for portrait viewing
Large text: Easily readable on small screens
Simple layouts: Avoid cluttered designs with tiny details
Fast loading: Optimized file sizes under 1MB
Product comparison charts, size guides, and step-by-step instructions perform exceptionally well on mobile devices, especially considering that mobile conversion rates are currently at 2.3%.
Implementation Roadmap: Your 90-Day Infographic Strategy

Days 1-30: Foundation Building
Audit existing content for infographic opportunities
Identify top 5 customer pain points from support data and reviews
Create your first 3 product-focused infographics addressing these pain points
Implement on highest-traffic product pages and measure baseline performance
Days 31-60: Expansion and Optimization
Launch social media infographic campaign with 2-3 posts per week
Add visual elements to email marketing campaigns
Create FAQ infographics for your most common support questions
Begin A/B testing different infographic styles and placements
Days 61-90: Scale and Systematize
Develop content calendar for ongoing infographic creation
Train team members on basic design principles and brand guidelines
Create templates and workflows for consistent visual content production
Analyze performance data and double down on highest-performing formats
Don't let another day pass watching competitors capture customers with compelling visual stories while your brand remains invisible. The tools, strategies, and templates are ready, all that's missing is your commitment to visual excellence.
Transform your e-commerce marketing today. Your customers are waiting to engage with your brand. make sure they can actually see what you're offering.